Core Web Vitals Optimisation UK: Why Your Performance Score Is a Google Ranking Factor
Core Web Vitals have been a Google ranking signal since 2021, and the rules changed again in 2024 with INP replacing FID. Here is what the metrics measure, why UK sites keep failing them, and what it takes to consistently score 90 or above.
Performance Is a Ranking Signal. Most Sites Are Still Ignoring It.
Google's Core Web Vitals became an official ranking factor in May 2021. In March 2024, they updated the metrics, replacing First Input Delay (FID) with Interaction to Next Paint (INP). Many UK sites that had previously passed the old threshold failed the new one almost immediately.
If your organic traffic dropped in early-to-mid 2024 without a clear reason, poor INP is one of the first places worth investigating.
Core Web Vitals are not about vanity scores. They measure real user experience: how fast content loads, how quickly the page responds to input, and how stable the layout is while loading. Google uses field data from real Chrome users to evaluate your site, not just lab tests.
Here is what each metric measures and why it matters.
The Three Core Web Vitals Explained
Largest Contentful Paint (LCP)
LCP measures how long it takes for the main content of a page to become visible to the user. This is typically the hero image, the largest heading, or a featured video.
- Good: Under 2.5 seconds
- Needs improvement: 2.5 to 4 seconds
- Poor: Over 4 seconds
Most sites fail LCP because of unoptimised images, slow servers, or render-blocking scripts that delay the browser from painting anything useful on screen.
Interaction to Next Paint (INP)
INP replaced FID in March 2024. Where FID only measured the first interaction, INP measures the responsiveness of every interaction throughout the session, including clicks, taps, and keyboard inputs.
- Good: Under 200 milliseconds
- Needs improvement: 200 to 500 milliseconds
- Poor: Over 500 milliseconds
INP is harder to pass than FID. Sites built with heavy JavaScript frameworks that process too much on the main thread often fail. Bloated analytics, third-party scripts, and large event listeners are common culprits.
Cumulative Layout Shift (CLS)
CLS measures visual stability. It captures how much the page layout unexpectedly moves as content loads. When a button shifts just before you tap it, or an article jumps when an ad loads above it, that is CLS in action.
- Good: Under 0.1
- Needs improvement: 0.1 to 0.25
- Poor: Over 0.25
Common causes include images or embeds with no specified dimensions, dynamically injected content, and late-loading web fonts that swap and cause text reflow.
Why Most UK Sites Still Fail
The problem is not awareness. It is architecture.
Most UK small business and SME websites are built on WordPress with page builders, or on Shopify themes loaded with third-party apps. These platforms make it easy to build something functional quickly. They make it very hard to achieve consistent 90+ Core Web Vitals scores.
WordPress sites typically suffer from:
- Too many plugins each adding their own scripts and styles
- Unoptimised images served at full original resolution
- Heavy page builders that generate bloated HTML and nested containers
- No automatic image format optimisation (WebP is still not universally handled)
- Shared hosting environments with slow Time to First Byte (TTFB)
Shopify themes often fail INP because of the JavaScript-heavy architecture many themes rely on for dynamic cart functionality, product filtering, and upsell widgets.
CDN caching helps at the margins. Image compression plugins help slightly. But patching a fundamentally slow architecture with optimisation plugins is an ongoing battle, not a solution. You end up maintaining the optimisation layer indefinitely rather than solving the underlying issue.
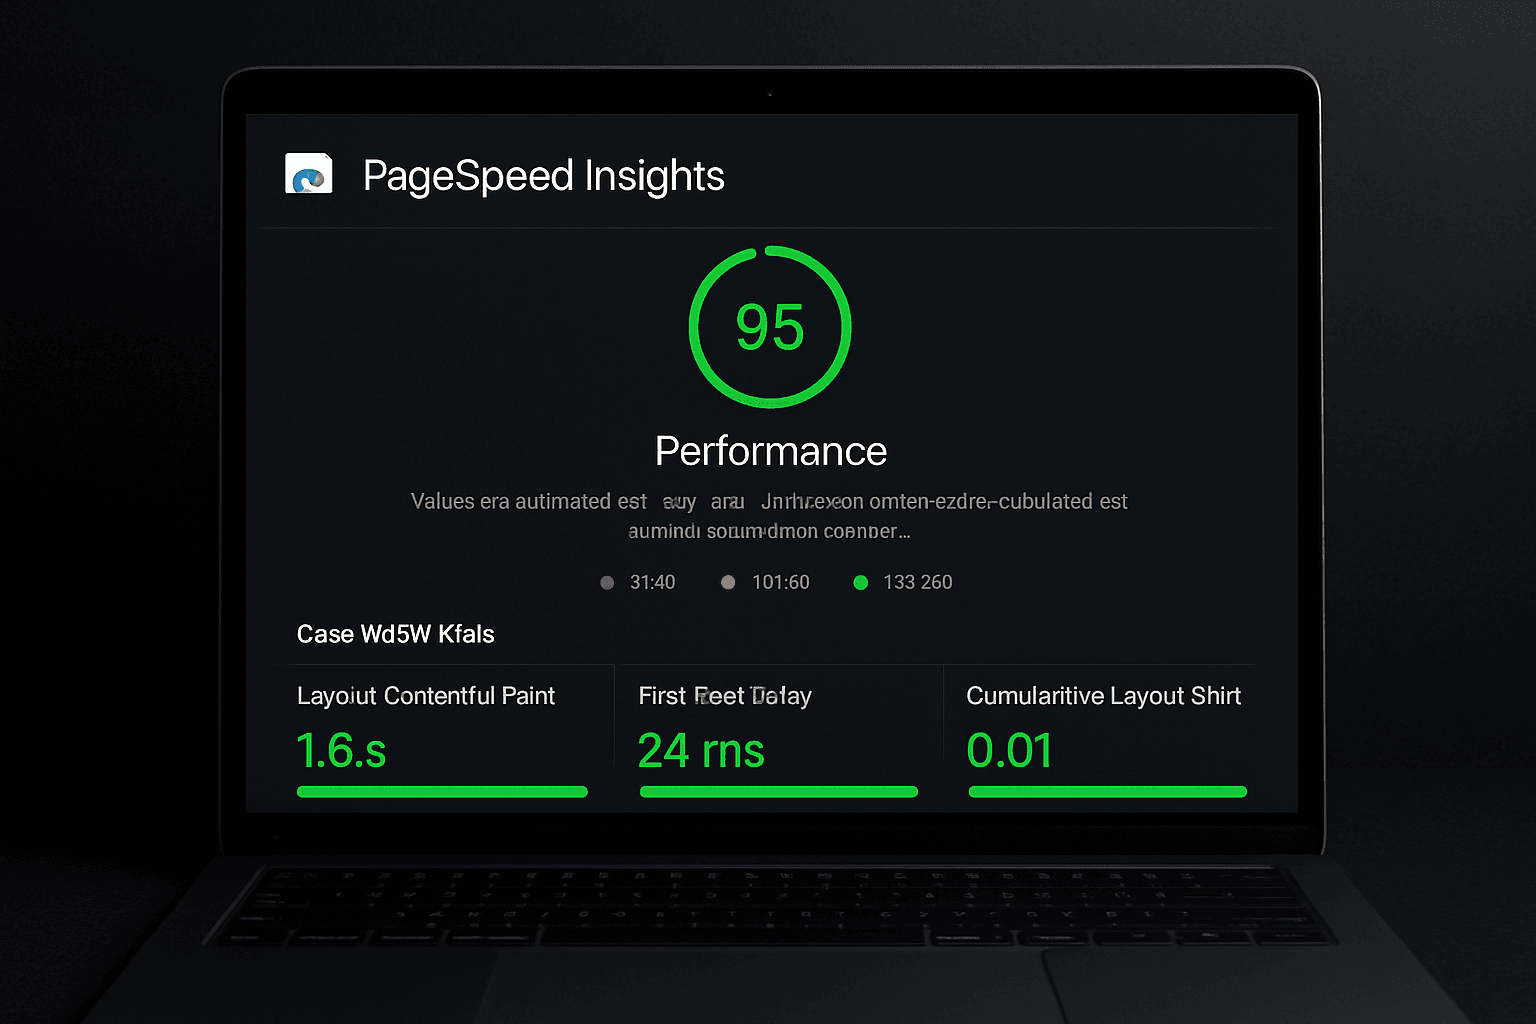
What 90+ Scores Actually Look Like
Consistent 90+ scores on Google PageSpeed Insights are achievable, but they require deliberate technical choices from the start of a project.
At TsvWeb, every site is built on Next.js, deployed on Vercel's edge network. This combination directly addresses the root causes of poor performance:
LCP: Next.js serves images via its built-in Image component, which automatically handles WebP conversion, lazy loading, and responsive sizing. Combined with Vercel's global CDN, content is delivered from the edge node nearest to each user. Time to First Byte under 100ms is routine.
INP: Next.js uses React Server Components and partial pre-rendering to minimise the JavaScript sent to the browser. Client-side interactivity is added precisely where needed, not applied to every page by default. Third-party scripts are loaded asynchronously and managed carefully to avoid blocking the main thread.
CLS: Every image has explicit width and height attributes. Fonts use font-display: optional or are self-hosted to prevent layout shifts on load. Dynamic content always has reserved space.
The results are consistent. Sites like The Revision Hub and Swiss Time Deals regularly score 95 to 100 on mobile and desktop PageSpeed Insights, not because we applied optimisation plugins afterward, but because the stack was chosen to perform before a single line of code was written.
How to Check Your Core Web Vitals
You have two data sources: lab data and field data.
Lab data is what you get when you run a test right now:
- PageSpeed Insights (pagespeed.web.dev) gives you both lab and field data if enough real users have visited your site
- Google Chrome DevTools Lighthouse tab (F12 in Chrome)
- WebPageTest (webpagetest.org) for deeper waterfall analysis and filmstrip views
Field data is what Google actually uses for ranking:
- Google Search Console has a Core Web Vitals report under the Experience section
- PageSpeed Insights shows CrUX (Chrome User Experience Report) data when your site has sufficient traffic volume
If your field data shows URLs flagged as "Poor" or "Needs Improvement", those are the pages actively costing you ranking positions. Prioritise them in order of search traffic volume.
The Real Cost of a Slow Site
Google has published research showing a direct correlation between site speed and conversions. A 1-second delay in load time reduces conversions by approximately 7%. For an e-commerce site doing £10,000 per month in revenue, that single second costs over £8,000 a year in lost sales.
Beyond conversions, organic visibility is affected too. Competing sites with faster, more stable experiences receive a measurable boost in rankings for overlapping keywords. A slow site is not just losing conversions. It is losing the traffic that would have driven those conversions in the first place.
The knock-on effect compounds: lower rankings mean fewer visitors, fewer conversions, and less revenue to reinvest in marketing. Speed is not a technical detail. It is a business metric.
Build Fast by Default
If your current site is underperforming on Core Web Vitals, the fix is rarely a plugin. It is usually a rebuild on a stack that performs by design.
A well-architected Next.js site deployed to the edge will outperform a heavily optimised WordPress site in almost every scenario, with less ongoing maintenance required.
If you want a site that scores 90+ without constant upkeep, get in touch with TsvWeb. Performance is not an add-on. It is the baseline every project starts from.